Five clients, identical hardware and providers, runs interleaved so provider drift cancels. The metric is time to a usable file - downloaded, verified, extracted - measured alongside the disk, free space and memory the job costs you. Every table names the builds it raced and the day it ran. Includes the legs we don't win.
On this page
The short version · measured 23 August 2026 on the code line that shipped as nzbfast 1.2.2
The newest rounds on this page ran on 23 and 24 August 2026 - the newest of them on the v1.2.2 release build itself - against the current builds of four other clients on identical hardware, lines and providers: two job shapes from 6.5 to 87 GB, and line rates from 250 Mbit to 10 GbE. Across those rounds no client was cheaper than nzbfast on processor, memory and disk together: each costs more on at least two of the three, the most any of them saved on any single axis was about 2 percent - a statistical tie, inside that client's own run-to-run spread - and on disk every one of them moved at least twice the bytes for a byte-identical result. As shipped, nzbfast also held the least memory of every client measured, on every fixture, by 2.0x to 4.5x against the nearest rival.
Which one is you?
Most downloaders write your download to disk at least twice: once while downloading it, and again while unpacking it. nzbfast does the whole job in one pass, so it writes about half the bytes per job, holds less in memory while it works, and spends fewer processor seconds per GB. That is less load on the machine while you use it and half the writes per job on your drives, for the same byte-identical files - and because each byte crosses the disk about once, your drive only has to keep up with your line once.
nzbfast does not win every table on this page, and the ones it loses are under the legs we don't win - including one from this same round. What held in every round we measured is the combined bill.
Methodology first
pipelining_requests=8 (it ships 1, i.e. unpipelined, and the setting is worth double-digit percentages on large jobs), NZBGet got ArticleCache/DirectWrite/DirectUnpack/ParQuick, rustnzb its documented config. Since 20 August 2026 every round races five providers rather than six - provider count is not a throughput lever on these boxes, where one provider alone can reach the line ceiling, and a fixed set keeps rounds comparable - so a six-provider figure on this page is not directly comparable with a newer five-provider one, and each table says which it ran.The 23 August 2026 round
Six arms on a 20-core Apple Silicon box on a 1 Gbit line: nzbfast at shipped defaults, the same binary with its connection governor switched off, and the current builds of the other four clients. Five providers, TLS everywhere, three repetitions per client per fixture with the order rotated inside each round, and every leg's output checked byte-for-byte: 36 of 36 legs produced the exact payload. At 1 Gbit the line sets the pace and the finish times converge by design, so the time column is there to show that convergence; the resource columns are what the round exists to measure.
One dial matters and it is stated rather than buried: shipped defaults now include a line-aware connection governor, and on this line it held 25 connections while every other client ran its configured hundreds. The "governor off" row dials the same 360 sockets our older rounds used, so both comparisons stay available: the product as a reader gets it, and the historical experiment.
| 6.5 GB named release, extraction in path | time to usable file | peak memory (RSS) | CPU time | device I/O (GiB) | wire (GB) |
|---|---|---|---|---|---|
| nzbfast, shipped (25 conns) | 58 s | 143 MB | 35.7 s | 6.2 | 6.5 |
| nzbfast, governor off (360) | 60 s | 583 MB | 38.0 s | 6.1 | 6.6 |
| NZBGet 26.3-testing | 61 s | 801 MB | 40.1 s | 12.5 | 6.5 |
| SABnzbd 5.1.1 | 63 s | 1,588 MB | 69.5 s | 13.8 | 6.5 |
| rustnzb 1.4.5 | 67 s | 628 MB | 61.9 s | 13.4 | 7.2 |
| Weaver 0.7.8 | 110 s | 531 MB | 34.9 s¹ | 12.5 | 6.5 |
| 34 GB obfuscated release | time to usable file | peak memory (RSS) | CPU time | device I/O (GiB) | wire (GB) |
|---|---|---|---|---|---|
| nzbfast, shipped (25 conns) | 302 s | 191 MB | 194.0 s | 32.5 | 34.4 |
| nzbfast, governor off (360) | 302 s | 465 MB | 205.4 s | 32.9 | 34.4 |
| NZBGet 26.3-testing | 306 s | 900 MB | 221.3 s | 68.1 | 34.4 |
| SABnzbd 5.1.1 | 308 s | 1,607 MB | 356.5 s | 72.5 | 34.4 |
| rustnzb 1.4.5 | 343 s | 445 MB | 332.6 s | 69.8 | 37.8 |
| Weaver 0.7.8 | 511 s | 1,076 MB | 373.8 s | 98.0 | 34.4 |
Measured 23 August 2026 against SABnzbd 5.1.1, NZBGet 26.3-testing, rustnzb 1.4.5 and Weaver 0.7.8, medians of three with every leg byte-checked, five providers, all TLS. The nzbfast arms ran a build of the same code line from earlier that day, some seven hours before the v1.2.2 release build, so their rows carry no version number; the 500 Mbit and 87 GB tables on this page did race the release build itself and say so. ¹ Weaver's CPU median on the 6.5 GB fixture is 2% below ours (34.9 against 35.7) with its own three legs spanning 34.1 to 56.1 s, so read it as a statistical tie; it is the one cell on either table a rival holds, and it is repeated under the legs we don't win. On the 34 GB fixture our CPU is lowest outright. Weaver's newer 0.8.3 ships no binary; our source build of it measured a processor pattern we cannot cleanly attribute to the version rather than to the build, so this table races the hash-proven 0.7.8 release asset and says so rather than publishing a confounded number. rustnzb 1.4.5 completed every leg here, the obfuscated fixture included.
The wire column, precisely. 6.5 GB on the clean fixture - the same figure NZBGet and SABnzbd report for themselves. The worst case we know of is a deliberately re-numbered obfuscated post, where steering around the scrambled numbering costs one extra article per steer: measured at 1.10-1.20x the minimum plan on both such shapes we could build. rustnzb's 7.2 and 37.8 GB cells are its own excess, with a warning in its log on two legs.
What the memory column means at defaults: the governor is most of why the shipped row holds 143-191 MB - fewer connections is less in flight - and switching it off (the second row) is the honest bridge to every older 360-socket table on this page. Even at 360 sockets we are level with the leanest rival (583 MB against rustnzb's 628 on the small fixture, 465 against its 445 on the large); at shipped defaults there is no tie left.
Slower lines · measured 24 August 2026 on nzbfast 1.2.2
On a line slow enough, every client's finish time is the wire and nothing else, so a slow line hides a lot of sins. What it cannot hide is what each client burns to fill it. We shaped the 1 Gbit rig to two rates real plans actually are and raced all six arms at each - same box, same five providers, three repetitions per client with the order rotated, every leg byte-checked, 36 of 36 correct across the two rounds. The nzbfast arm at 500 Mbit is the v1.2.2 release build itself.
| 500 Mbit line, 6.5 GB release | time to usable file | peak memory (RSS) | CPU time | device I/O (GiB) |
|---|---|---|---|---|
| nzbfast 1.2.2, shipped | 109 s | 142 MB | 45.4 s | 6.2 |
| nzbfast 1.2.2, governor off | 115 s | 592 MB | 59.0 s | 6.2 |
| SABnzbd 5.1.1 | 125 s | 1,665 MB | 99.2 s | 14.2 |
| rustnzb 1.4.5 | 131 s | 626 MB | 92.6 s | 14.5 |
| Weaver 0.7.8 | 138 s | 564 MB | 48.5 s | 12.4 |
| NZBGet 26.3-testing | 145 s¹ | 846 MB | 64.3 s | 13.2 |
| 250 Mbit line, the same release | time to usable file | peak memory (RSS) | CPU time | device I/O (GiB) |
|---|---|---|---|---|
| nzbfast, shipped | 217 s | 144 MB | 53.3 s | 6.2 |
| nzbfast, governor off | 219 s | 651 MB | 67.9 s | 6.2 |
| NZBGet 26.3-testing | 227 s | 826 MB | 78.4 s | 13.3 |
| SABnzbd 5.1.1 | 230 s | 1,667 MB | 162.4 s | 15.2 |
| Weaver 0.7.8 | 230 s | 789 MB | 62.0 s | 12.9 |
| rustnzb 1.4.5 | 256 s | 644 MB | 122.4 s | 15.4 |
Read the two tables as a gradient. At 250 Mbit the whole field lands within 18% on the clock and we lead the nearest rival by 4.4%; at 500 Mbit the gap opens to 14.7%; at the gigabit and 10 GbE rates in the tables above and below it opens further. Speed differences grow with the line. The resource columns do not wait for a fast line: at every rate measured, every rival held at least 3.9x the memory, spent more processor, and moved about twice the disk bytes for the same byte-identical file.
The connection governor earns its keep on slow lines, and the shaper's own drop counter says why. Shipped defaults held 25 connections where every rival ran hundreds; the same binary with the governor off ran 360. Fewer flows through a fixed queue means less loss and less resending: the shaper recorded about 4,200 drops per capped leg against about 155,000 uncapped at 500 Mbit, and the capped arm was faster, 4.2x lighter on memory and 1.3x lighter on CPU than our own 360-socket posture. More connections is not more speed; below a gigabit it is measurably the opposite.
Measured 24 August 2026, medians of three, on a 20-core Apple Silicon box with its line shaped to each rate (the shaped rate verified by an independent probe before each round: 248 and 496 Mbit). The 500 Mbit nzbfast arm is the v1.2.2 release tag build; the 250 Mbit round ran hours earlier on the same code line. Byte counts on a shaped line are read from each client's own counter, never the network interface (the shaper drops and TCP resends, so the interface counts both copies). Walls are comparable within each table, not across differently shaped rounds. ¹ NZBGet's three legs at 500 Mbit spanned 114-158 s with flat resource readings - a genuine spread, so the median is quoted and the spread is stated rather than narrowed.
The big file · measured 24 August 2026 on nzbfast 1.2.2
The other end of the line-rate story: a 10 GbE box, five providers, an 87 GB post whose payload is one 76.6 GB video, six arms, three repetitions rotated, and every leg's output byte-checked - 18 of 18 legs produced the identical file, all six clients agreeing on its checksum. The nzbfast arms are the v1.2.2 release build.
| 87 GB post, 10 GbE | time to usable file | peak memory (RSS) | CPU time | device I/O (GiB) | wire (GB) |
|---|---|---|---|---|---|
| nzbfast 1.2.2 (50 connections)¹ | 70 s | 415 MB | 144 s | 72.9 | 77.2 |
| nzbfast 1.2.2, connection governor on (25) | 90 s | 336 MB | 130.5 s | 72.9 | 77.4 |
| NZBGet 26.3-testing | 93 s | 1,195 MB | 443 s | 183.7 | 77.2 |
| SABnzbd 5.1.1 | 113 s | 1,910 MB | 234 s | 235.1 | 77.2 |
| Weaver 0.7.8 | 645 s | 1,825 MB | 631 s | 435.1² | 77.3 |
| rustnzb 1.4.5 | 869 s³ | 681 MB | 2,444 s | 216.1 | 86.9 |
The disk story at its largest scale yet. Our peak disk during the job is 70.8 GiB - BELOW the 76.6 GB output, because the tail of the payload is still arriving while the head is already final - and total device I/O is 1.00x the payload. The rivals move 2.5x to 6.0x the bytes for the same file. And the fastest arm sustains about 8.7 Gbps including in-stream verification and extraction; the moment the download bar fills, the file is done.
¹ Every client on this page is raced at its documented best settings, and on a 10 GbE line ours is 50 total connections - 10 per server, a dial any account tier reaches - the same one-setting tuning we give every rival (SABnzbd its pipelining, NZBGet its article cache). Fifty is not a handicap: a six-rung sweep on this same fixture found the wall identical from 50 connections all the way to the account maxima of 360, while processor cost rises 2.3x across that range for nothing, so the maxima buy nothing this table would show. The 50-connection row was then re-measured at full three-repetition quality the same day, on the same box, against the same output checksum: 70 / 70 / 70 s, all three byte-checked. The governor row is here because it is the more interesting one: at every rate up to a gigabit its 25 connections are free-to-faster, and even here, where they cost about a fifth of the wall, they buy 336 vs 415 MB of memory and 130 vs 144 CPU-seconds. Scaling the governor with the line rate automatically - so the best behaviour is also the default, at the knee rather than the maxima - shipped in 1.2.3, the release after the one measured here. ² Weaver's 435 GiB of device I/O for a 77 GB download is its encrypted-at-rest store re-reading and re-writing nearly everything as the job grows - the superlinear pattern our July instrumented rounds measured, still present on the current build. ³ rustnzb 1.4.5 completes byte-correct and its cost is processor time and wire: about 2,444 CPU-seconds against an 869 s clock across all three reps, and 86.9 GB pulled where the eager plan is 77.2 (it fetches the full recovery set unconditionally). Measured 24 August 2026, medians of three, every build current; rep 3 for the three fastest arms ran ~40 minutes after the rest (a free-space guard paused the round; the offset moved no median by more than the rep spread).
Since this round, the governor row is superseded by what 1.2.3 ships. Measured 26 August 2026 on the same fixture, box and 10 GbE line, six legs byte-correct against this table's checksum: 71 s at shipped defaults, 322 MB and 139.3 CPU-seconds, against the 90 s above. An nzbfast-only round on a later build, so it is stated here rather than raced into the table: every row above stands as measured on 24 August.
The first commercial client on this page: Newsbin Pro, the longest-standing paid Windows client, raced against our official Windows build on a native-Windows 10 GbE machine whose TLC system drive sustains 0.99 GB/s of writes - the slowest disk in our test fleet, which makes it the honest place to race a staging client. Same 87 GB post, three repetitions interleaved, every leg's output byte-checked against the same checksum as the table above: 6 of 6 identical.
| 87 GB post, Windows, TLC disk | time to usable file | peak memory (RSS) | CPU time | device I/O (GiB) | wire (GB) |
|---|---|---|---|---|---|
| nzbfast 1.2.2 (50 connections) | 105 s | 469 MB | 154 s | 84.5 | 76.7 |
| Newsbin Pro 6.90 (360 connections) | 477 s | 881 MB | 1,862 s | 154.1 | 76.7 |
Measured 24 August 2026, medians of three, both clients current. Newsbin ran at its own configured per-server connection maxima - 360 sockets to our 50 - and its times exclude the 90-second settle our harness waits before declaring a watched client finished, so the comparison leans its way twice and the result stands anyway: 4.5x the wall, 12x the CPU-seconds, and 1.9x the memory for the identical file. Neither side is disk-bound here - the one-pass arm needs about 0.73 GB/s of the drive's 0.99, and Newsbin averages a third of that while keeping nearly four processor cores busy for eight minutes - so the gap is the client, not the hardware. Both clients pulled the same wire bytes for the payload. Newsbin is a registered trademark of CMCE, Inc.; the client is published by DJI Interprises, LLC.
The census
Re-weighed August 2026 on a far larger population. The July census below read two groups; the index behind it now holds 13.2 million releases and 174.7 TB across 114 groups, and the mix moved - 7z archives grew from under 2% of bytes to a major share. Re-measured on that population, about 95% of complete-release bytes go through in one pass (94.3% to 96.3% across four ways of cutting the population), and the qualifier that actually matters is not the archive shape but the password: about a third of the bytes need one to produce output at all, whatever client you run. The July snapshot stays below as the snapshot it is.
For the July census we looked at 890,852 releases, 1.6 million files and 79.6 TB across the two busiest movie and TV groups, then fetched and read the archive headers of a thousand real posts to confirm what the filenames only implied. Counted by bytes rather than by post, because a million tiny files matter less than one large one.
That reshaped what we work on. There is little point tuning a compression path that carries 1.4% of the data, so we tuned the two that carry the rest.
Encryption is not spread evenly either. It scales with size:
| Release size | Share of all data | Stored | Encrypted |
|---|---|---|---|
| 1-5 GB | 29% | 94% | 2% |
| 5-20 GB | 39% | 97% | 2% |
| 20-60 GB | 20% | 67% | 33% |
| over 60 GB | 12% | 51% | 49% |
Ordinary downloads are almost always plain stored archives. The big ones are a coin flip between stored and encrypted. The stored shape is what every current table on this page races; the encrypted shape's disk story is measured in its own section below.
The damaged post · re-raced 24 August 2026, every build current
Articles expire, servers quietly drop them, uploads land incomplete - and damage is where the gap between clients is widest, so it gets its own round on the newest build of every client, nzbfast v1.2.2 included: Europe 10 GbE box, five providers, 100 connections per client, the same 6.5 GB release poisoned at three damage levels, three repetitions per arm with the order alternated, every leg byte-checked against the clean file. 63 of 65 legs came back byte-identical; the two that did not are named below, because they are results.
| time to a verified, usable file (mean of 3) | 60 dead articles | 20 dead | 5 dead |
|---|---|---|---|
| nzbfast 1.2.2 | 13.0 s | 10.0 s | 8.7 s |
| nzbfast 1.2.2, early-repair switched off | 29.3 s | 19.0 s | 12.3 s |
| NZBGet 26.3-testing | 33.0 s | 23.7 s | 23.0 s |
| SABnzbd 5.1.1 | 48.0 s¹ | 28.0 s | 24.3 s |
| rustnzb 1.4.5 | 107.3 s² | 51.3 s | 47.0 s |
| Weaver 0.7.8 | did not finish³ | did not finish³ | 194.0 s |
Why the damaged post is fast here. When an article is missing, a client normally asks the next server, then the next, until every server has refused it - a serial walk whose refusals take anywhere from tens of milliseconds to a couple of seconds each, during which the download sits at zero. nzbfast stops asking: once the parity data already in hand covers what is still missing, it repairs immediately instead of finishing the walk. That is the second row - the same binary with that behaviour switched off is 1.4x to 2.3x slower depending on damage - and the round verified the mechanism engaged on every enabled leg and never on a disabled one. Against the nearest rival the margin is 2.4x to 2.7x, with no overlap in any of the nine repetition pairs.
Disk is where the margin is widest, and it is not the repair trick. Every completing arm produced the same 6.48 GB file; ours moved 6.2-6.8 GB of disk I/O doing it, NZBGet 12.7-18.5 GB, SABnzbd 13.9-20.3 GB and rustnzb 12.8-13.1 GB. That is the one-pass pipeline - the switched-off row moves the same 6.2 GB - so it holds on damaged and undamaged posts alike.
¹ SABnzbd's three legs at the heaviest damage ran 43, 41 and 60 s - a genuine spread on identical inputs, so the mean is quoted with the range stated. ² rustnzb 1.4.5 delivered every leg byte-correct, and its cost sits in processor time rather than reliability: about 1,620 CPU-seconds against a 107 s clock at the heaviest damage - roughly fifteen cores busy for the whole leg - where the same repaired output costs us about 50 CPU-seconds. ³ Weaver moved 1.5 GB and 4.9 GB of the 6.5 within our 20-minute cutoff at the two heavier damage levels - the same non-finish in all three rounds that have raced it, on three separate nights; the cutoff is ours and the non-finish is the result. At 5 dead articles it completed correctly all three times. Its processor cost there is its own story: about 2,325 CPU-seconds for the 194 s leg, against our 20.
Measured 24 August 2026, all builds current: nzbfast v1.2.2 (the release tag itself), NZBGet 26.3-testing (20 August build), SABnzbd 5.1.1, rustnzb 1.4.5, Weaver 0.7.8. A continuity arm raced the previous night's nzbfast build inside this same round and landed within a second of v1.2.2 on every fixture, so nothing here rides a lucky night; and the rival configurations differ from the previous round's by application path only, checked key by key before the round ran.
The honest column
This section exists for the legs a rival wins, and it is re-measured every round rather than curated: anything we lose goes here, named, next to the table that shows it. On the current build, this round, it is empty of speed losses - which is worth being careful about rather than pleased about, so the trades that remain are stated below instead.
What has not gone away is the trade behind those numbers, so that is what this section says now: we spend more memory than the standalone tools do, and the fast heavy-repair path spends the most. Our extractor and repairer are built to ride a live download rather than to run once from a command line, and that costs resident memory; the detail is beside the component tables. If your constraint is the smallest possible footprint for a one-shot job, the dedicated tools win that column and we are not going to pretend otherwise.
And the 23 August 2026 round adds an entry, which we would rather list here than leave in a footnote: on the 6.5 GB fixture, Weaver's processor median is 2% below ours - 34.9 against 35.7 CPU-seconds, with its own three legs spanning 34.1 to 56.1 s - so we call it a statistical tie, and it sits in the cost table marked as the one cell we do not hold. On the 34 GB fixture in the same round our CPU is lowest outright.
Starve it of RAM · measured 24 August 2026 on nzbfast 1.2.2
The same 87 GB job as the round above, re-run at hard memory budgets of 2 GB, 1 GB and 256 MB - what the auto-sizer would pick on an 8 GB box, a 4 GB box, and a 2 GB NAS. Every leg produced the identical byte-checked file, and the memory column tracked the budget, never the job:
| 87 GB job, 10 GbE | auto | 2 GB budget | 1 GB budget | 256 MB budget |
|---|---|---|---|---|
| time to usable file | 94 s | 87 s | 94 s | 102 s |
| peak memory (RSS) | 286 MB | 558 MB | 336 MB | 284 MB |
| disk I/O (GiB) | 73.2 | 73.2 | 72.8 | 72.7 |
Single leg per budget on the release build, gated against the same output checksum as the six-arm round. The tightest budget costs about 9% of wall, and only because this line is 10 GbE - spilled blocks cost time only when the line outruns the disk, so on a typical home connection a small budget is close to free. The whole ladder, an 87 GB download included, fits in 0.3-0.6 GB of memory; at shipped defaults the job ran in 286 MB. No other client offers a hard process-wide memory budget; the closest things are cache-size knobs, and the round below measures what those cost.
The clamp raced against the field's own knobs. On the 34 GB fixture (23 August 2026, 1 Gbit box, five providers, 30 of 30 legs byte-correct), holding NZBGet to an equivalent cache clamp more than doubled its CPU (215.5 to 453.0 CPU-seconds, 2.10x) to buy a 52% cut in its peak memory, and SABnzbd's clamp was nearly free but reached only part of its footprint. rustnzb's cache setting was decorative in the build raced, and Weaver has no memory knob at all, so both ran unclamped as reference columns rather than being scored at a budget they cannot hold. Our own side of that round is superseded by the v1.2.2 ladder above, which says the same thing at 2.5x the size: the budget is never the binding constraint, because one-pass holds so little to begin with.
Free space · measured to the megabyte
A write-out-and-unpack client needs room for the archive volumes and the unpacked payload at once, so a job will not start without roughly twice the download free. One-pass needs the payload - and this round measured how little more, by shrinking the target volume until each client failed. nzbfast's answer is a constant of about 50 MB of headroom, not a ratio, and it holds from a 6.5 GB job to a 34 GB one.
| free space the job needs | 6.5 GB job | 34 GB job |
|---|---|---|
| nzbfast 1.2.2 | the output + 48.6 MB | the output + 51.0 MB |
| NZBGet 26.3-testing | ~2.1x the payload | ~2.1x (37.6 GB over the output) |
| SABnzbd 5.1.1 | ~2.1x the payload | ~2.1x (37.6 GB over the output) |
| rustnzb 1.4.5 | ~2.25x the payload | ~2.25x (42.7 GB over the output) |
| Weaver 0.7.8 | ~2.25x the payload | ~2.25x (42.7 GB over the output)¹ |
Measured on a 20-core Apple Silicon box, 1 Gbit line, five providers, three repetitions at each bound, every completed leg byte-checked - the rival rows on 22-23 August 2026 (Weaver's 34 GB cell re-run on 24 August, footnote 1), and the nzbfast row re-cut on the v1.2.2 release build on 24 August, which reproduced both bounds exactly, 12 of 12 legs unanimous across the two fixtures. Our cells are a measured floor: the job completes 3 of 3 with 48.6 MB and 51.0 MB of headroom, and refuses 3 of 3 about 17 MB below that - so the floor is real in both directions. What the job actually holds settles at the output plus about 3 MB; the headroom pays for the last moments of the pipeline, never for a second copy. The rivals' cells are their measured floor on the 6.5 GB job and a confirmed sufficiency at the same ratio on the 34 GB one (3 of 3 byte-correct at exactly that ratio); we did not walk their ladder further down at the larger size, so their true floor there may sit somewhat below the ratio, and we say so rather than rounding in our own favour.
What running out actually looks like matters as much as the number. At 17 MB below its floor nzbfast hits the disk's refusal on a write, stops cleanly with "out of disk space", keeps everything that landed journaled, and a retry resumes without refetching - a partial you keep, not a failed job. ¹ Weaver's large-fixture cell was settled by a re-run on 24 August: three legs of three byte-correct at the same ~2.25x, each of them faster than the good leg of the first attempt, on free space identical to the byte. On the first attempt, 23 August, two of its three legs had stalled at single-digit MB/s with more than 60 GB still free and hit the round's 40-minute cutoff. Those stalls did not come back, and the rig's stall instrumentation was deployed and silent across all three re-run legs, which is a positive reading rather than an absent one. What caused them is still unknown, and a clean re-run is not a diagnosis: six legs now exist at this ratio, four of them completed, and both failures came from one 80-minute window on the first night.
The multiplier's consequence
For any drive, the line speed you can sustain through download, verify and unpack is the drive's real rate divided by the client's I/O multiplier. The cost tables above measure ours at about 1.0x - each byte crosses the disk about once - and every rival at 2.0x to 3.0x for byte-identical output. So the same drive sustains two to three times the line speed under nzbfast that it would under a staging client. The arithmetic, with the multipliers taken from the measured tables above:
| line | payload rate | disk needed at our ~1.0x | at 2.2x | at 3.0x |
|---|---|---|---|---|
| 100 Mbit | 12.5 MB/s | ~13 MB/s | ~28 MB/s | ~38 MB/s |
| 1 Gbit | 125 MB/s | ~130 MB/s | ~275 MB/s | ~375 MB/s |
| 5 Gbit | 625 MB/s | ~650 MB/s | ~1,400 MB/s | ~1,900 MB/s |
| 10 Gbit | 1.25 GB/s | ~1.3 GB/s | ~2.75 GB/s | ~3.75 GB/s |
Set those columns against what drives really sustain. A 5400/5900 rpm NAS drive holds roughly 100-140 MB/s on its outer tracks, decaying toward 80-100 as it fills - so gigabit is already borderline at 1.0x on the slowest class, which we say plainly, and out of reach at 2-3x. A 7200 rpm drive holds roughly 160-220 MB/s. A SATA SSD's ~550 MB/s caps a 2.2x client near 2 Gbit and carries about 3.5-4 Gbit at 1.0x. SMR drives, sold into NAS bays for years, are the worst case for the staging pattern specifically: sustained writing with read-back can collapse to tens of MB/s once the drive's reshingling cache exhausts. And a multi-gig line is the same wall higher up: 10 Gbit at a 2-3x multiplier demands 2.75-3.75 GB/s sustained, past every SATA drive and past many NVMe drives once a large job outruns their fast-cache zone, while at 1.0x a ~2 GB/s SSD keeps up with the line speed with room to spare.
Measured rather than asserted, on a throttled disk. We capped a disk at 150 MB/s - a 5400 rpm class rate - and ran the same download twice: once one-pass, once followed by the staging pattern's write-out, read-back and unpack. The one-pass arm kept up with the 1 Gbit line at 109.9 MB/s, 0.2% below its own uncapped rate; the staging pattern fell to 59.0 MB/s, 54% of the line. Swept parametrically with no line limit, the one-pass arm took 97% of whatever the disk offered at every cap (290.7 MB/s of a 300 MB/s cap, 145.6 of 150) at a measured 1.00-1.03x device I/O, and the staging pattern took 47-48% at a measured 3.02x - the ratio constant across caps, which is the arithmetic above reproduced as a measurement. 32 legs, every output byte-checked.
And once on real hardware, unthrottled. The slowest drive in our test fleet is a TLC system disk on a native-Windows 10 GbE machine, sustaining 0.99 GB/s of writes where our fastest test box sustains 5.97. The 87 GB Windows round above ran on it: the one-pass arm needed about 0.73 GB/s of that 0.99 to hold 105 s of wall - headroom to spare on the fleet's worst disk - which is the top-right cell of the table above landing on a real drive rather than a throttled one. And the fast end of the fleet closes the argument from the other side: the same 87 GB job, full-rate at 10 GbE, finishes in the same 70-71 seconds on a 1.24 GB/s drive and on a 5.97 GB/s drive - a 4.8x faster disk moves the wall by zero, because at a 1.0x multiplier the line runs out long before the drive does. For a staging client those two drives are different worlds.
What that rig is and is not. The disk was capped with an operating-system I/O controller inside a virtual machine on a 32-core Apple Silicon box, and the staging arm is our own binary made to write, read back and rewrite the way a staging client does. No rival ran in it - the rig's mock line serves plain files a rival would also handle in one pass, so pointing one at it would demonstrate nothing - which means the table above is arithmetic anchored by one measured pair, with the rivals' multipliers taken from the real five-client tables above, and we label it that way on purpose. Three honesty notes go with it. The controller budgets reads and writes separately, which flatters the staging arm; on a single-budget device, which is every spinning disk, its share would be lower still. The staging multiplier is about 2x when the volumes are still in the page cache at read-back and 3x when they are not, so a big job on a normal machine sits at the 3x end. And the seek cost of writing, reading back and deleting hundreds of volume files - against one file written once in order - is an argument from the shape of the traffic, not yet a measurement: it needs a spinning disk, and we quote it as an argument until it has one.
Shape two · the big-release coin flip
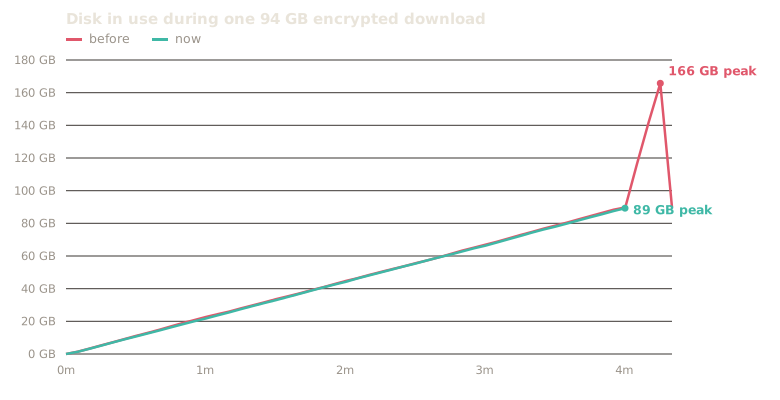
Half of everything posted over 60 GB is an encrypted archive, and it is the shape where staging clients pay most: the locked data has to be written out, read back, unlocked and written again. nzbfast unlocks each piece as it arrives, so the locked data never reaches the disk at all. Measured on a real 94 GB encrypted release:
| 94 GB encrypted release, one pass | measured |
|---|---|
| Written to disk | 90.1 GB - about the payload, once |
| Most disk used at once | 89.6 GB - the output file itself |
| Pause after the download | 0.6 s |
The most disk used at once is the size of the file you asked for. There is no moment during an encrypted download when nzbfast needs room for a second copy, and no unlock pass after the download bar fills - a staging client pays roughly double on all three of those rows, which is the same 2x the cost tables above measure on every other shape.
Disk in use during one download, sampled every five seconds. The flat line is nzbfast; the line that climbs to 166 GB at the end is the write-out-and-unlock pattern, paying for the finished file while the locked copy is still on disk - measured by running both patterns over the same release.
Wrapped posts · measured 28 August 2026
A lot of what gets posted is deliberately hard to open. The real filename is buried inside a second archive, sometimes a third, sometimes in a different format at each level, so the post gives away as little as possible about what it holds. On top of that, posts arrive damaged: articles expire, uploads land incomplete, and the recovery data has to be used before anything can be unpacked. A downloader either walks that chain for you or it hands you a folder of archives and stops.
So we built ten shapes that isolate exactly that, raced every current client against them, and then did something benchmarks usually skip: where a client stopped early, we finished the job by hand with the standard tools and timed that too. A client that gives up quickly looks fast until you count the work it left you.
| ten wrapped and damaged shapes | finished on its own | only after manual repair | never reached the file |
|---|---|---|---|
| NZBGet 26.3 | 2 of 10 | 8 | 0 |
| SABnzbd 5.1.2 | 5 of 10 | 3 | 2 |
| nzbfast 1.2.4 | 10 of 10 | 0 | 0 |
| rustnzb 1.4.5 | 7 of 10 | 1 | 2 |
| Weaver 0.7.8 | 1 of 10 | 1 | 8 |
nzbfast is the only one that finishes all ten without help. NZBGet reaches the file on every shape too, but needs 16 rounds of manual repair and extraction across eight of them. SABnzbd finishes five unaided and two are unreachable even by hand. Weaver reaches the file on two.
The pattern is not random. The shapes nzbfast walks and the others do not are the wrapped ones and the damaged ones: an archive inside an archive, a format change part-way down, a five-level chain, and above all an archive that arrives corrupt with its own recovery data packed alongside it. On that last one four clients unpack the outer set perfectly, hand you the broken archive together with the recovery set that would fix it, and stop.
Where clients finish the same work, the cost is not close. These are the seven shapes all four mainstream clients reach, counting the manual repair each needed:
| the seven shapes all four reach | time to a usable file | written to disk |
|---|---|---|
| NZBGet 26.3 | 51.2 s | 29.83 GB |
| SABnzbd 5.1.2 | 52.3 s | 32.27 GB |
| nzbfast 1.2.4 | 10.3 s | 11.68 GB |
| rustnzb 1.4.5 | 41.8 s | 27.75 GB |
Four to five times quicker, on under half the bytes written. The disk figure is the one that keeps mattering after the download: every gigabyte in that column is a gigabyte your drive had to absorb, and the clients that stage the job write the payload out, read it back and write it again.
Where we are not ahead, and why it is worth saying. On four of the ten shapes a rival writes fewer bytes than nzbfast during the download itself. In every case it is because it did less: on the corrupt-inner-archive shape NZBGet writes 3.29 GB to our 4.65 and then its repair pass writes another 2.91, finishing at 6.20 GB against our 4.65. On the others the client that wrote least is one that never reached the file at all. A small disk number is not always thrift.
These are capability tests, not speed tests. The payloads are small and are served from memory over a local connection, with no provider and no network in the path, so nothing here is limited by download speed and the absolute seconds are far shorter than the same shapes would take in the real world. Whether a shape needs manual work at all is a property of the shape and the client, and transfers directly. The seconds are a comparison between clients doing identical work, not a prediction of how long a real job takes.
Full per-shape results, what each shape is, and the method are on the nested-archive data page.
Why it matters
Flash storage wears out by being written to. A 94 GB release costs your drive about 90 GB of writing under nzbfast; under a client that stages and unpacks, the same release costs roughly double. On a NAS with hard disks the one-pass shape also removes the long single-threaded pass at the end of every encrypted download - a pause measured at 20 seconds on a fast 32-core workstation with hardware-accelerated unlocking, and correspondingly longer on the low-power machines most people actually run this on. We quote the small number because it is the one we measured.
Component shootouts
Repair (PAR2) and unpack (RAR) are our own native code rather than bundled third-party binaries, so we also race them standalone against the dedicated tools on identical corpora, on four machines spanning what a reader might actually own. A time only counts when the output is byte-identical to the source payload: every RAR figure below was sha256-checked against the source, and every repaired file against the pristine set.
The previous round of this table used 100 MB to 200 MB per shape, which was a mistake: about 28 ms of process launch was 40% of the store leg, and the ordering it produced does not survive at a realistic size. This round is 1 GB of payload per shape, and it changes several answers, including some in the other direction. Archives are created by official rar 7.23, so no tool is judged on input from its own encoder, and the same bytes are raced on every machine.
What is in the payload matters more than it looks. A payload built out of block copies makes every compressed shape a memory-copy benchmark; a payload of pure text makes it a literal-and-Huffman benchmark; we measured both and they do not agree on who wins. So the four compressed shapes use equal thirds of text, structured records and incompressible bytes, and the two shapes at the ends of that range are separate legs on purpose: store is incompressible and repetitive is almost all matches. The builder and the harness are in the repository, so the corpus can be rebuilt byte for byte.
Re-raced 23 August 2026 on the 1.2.2 engine, and the sweep stands. The three tools a reader most often weighs - ours, unrar 7.23 and rarpar 0.2.5 - were re-raced on the 32-core desktop on the release engine (the extraction code raced is byte-identical to the 1.2.2 tag), six interleaved rounds, minimum per tool, every leg's output checked against the payload manifest. Seconds, lower is better:
| 1 GB payload, 32 cores (23 Aug 2026) | store | 400 small files | solid | repetitive | big, 3 volumes | encrypted | 128 MiB dictionary |
|---|---|---|---|---|---|---|---|
| nzbfast 1.2.2 | 0.119 | 0.474 | 1.515 | 0.120 | 1.118 | 1.137 | 1.146 |
| unrar 7.23 | 0.190 | 2.032 | 1.784 | 0.139 | 1.655 | 1.846 | 1.420 |
| rarpar 0.2.5 | 0.206 | 2.563 | 2.395 | 0.237 | 1.852 | 1.857 | 1.725 |
All seven shapes ours, on the minimum and on the median, 1.16x to 4.29x against unrar. These times are not comparable cell-for-cell with the wider table below - the harness has been revised since that table's rounds and the round counts differ - so read each table against itself. The wider table keeps its own dates and its six-tool field, and its nzbfast column describes the engine 1.2.2 ships: the re-race above measured the current engine level with that table's build on all seven shapes, settled by hardware instruction counts (0.14% fewer for the same wall), so those cells are not a superseded build's numbers wearing a current label. This re-race is also where the A/A rule in the setup section was earned. A same-day pass first reported one shape as a small regression against our own previous build, and the reading survived running both arm orders. An A/A control - the same binary raced against a byte-identical copy of itself - showed the harness handing whichever arm ran first about a 1.5% penalty: the identical binary won only 6 of 15 rounds from the first slot, and swapping orders does not cancel a bias that always lands on whoever is first. Hardware instruction counts settled the question the harness could not - the newer build retires 0.14% fewer instructions for the same wall clock, so there was no regression. Every our-build-against-our-build comparison we publish now carries that control.
The whole field, seconds, lower is better. Best of three, tools interleaved inside each round rather than run in blocks, output checked against the source payload on every single run. A tool that produced the wrong bytes gets a correctness note, never a fast time. rarpar is Weaver's own RAR and PAR2 code, built from source at bd87611; we pin the commit rather than a version because its crates carry three different version numbers.
| seconds, 1 GB per shape | store | 400 small files | solid | repetitive | big, 4 volumes | encrypted | 128 MiB dictionary |
|---|---|---|---|---|---|---|---|
| High-end desktop, 32 cores | |||||||
| nzbfast | 0.21 | 0.47 | 1.26 | 0.14 | 1.08 | 1.09 | 1.07 |
| unrar 7.23 | 0.21 | 2.02 | 1.62 | 0.16 | 1.61 | 1.82 | 1.37 |
| rarpar | 0.23 | 2.55 | 2.22 | 0.26 | 1.75 | 1.74 | 1.64 |
| unar 1.10.7 | 0.60 | 6.40 | 5.29 | 0.69 | 5.41 | 6.88 | 4.03 |
| bsdtar | 0.34 | 13.67 | 11.48 | 1.86 | wrong output² | no crypto³ | no big dict⁴ |
| 7-Zip | 0.30 | unsupported¹ | unsupported¹ | unsupported¹ | unsupported¹ | unsupported¹ | unsupported¹ |
| Older desktop, 20 cores | |||||||
| nzbfast | 0.16 | 0.57 | 1.83 | 0.15 | 1.50 | 1.51 | 1.40 |
| unrar 7.23 | 0.25 | 2.48 | 2.31 | 0.20 | 2.28 | 2.49 | 1.84 |
| rarpar | 0.28 | 3.15 | 3.00 | 0.31 | 2.26 | 2.26 | 1.97 |
| unar 1.10.7 | 0.67 | 7.49 | 6.93 | 0.85 | 6.85 | 8.49 | 5.29 |
| bsdtar | 0.33 | 15.58 | 13.97 | 2.18 | wrong output² | no crypto³ | no big dict⁴ |
| 7-Zip | 0.33 | unsupported¹ | unsupported¹ | unsupported¹ | unsupported¹ | unsupported¹ | unsupported¹ |
| Laptop, 14 cores / 20 threads, Windows⁵ | |||||||
| nzbfast | 0.35 | 1.05 | 2.92 | 0.32 | 2.32 | 2.22 | 2.04 |
| unrar 7.23 | 0.63 | 6.37 | 6.14 | 0.62 | 2.92 | 3.33 | 2.44 |
| rarpar | 0.74 | 11.58 | 9.76 | 0.54 | 2.72 | 2.85 | 2.38 |
| unar | no CLI⁵ | no CLI⁵ | no CLI⁵ | no CLI⁵ | no CLI⁵ | no CLI⁵ | no CLI⁵ |
| bsdtar | 0.81 | 16.72 | 15.14 | 1.13 | wrong output² | no crypto³ | no big dict⁴ |
| 7-Zip | 0.76 | 5.45 | 5.79 | 0.65 | 4.21 | 4.13 | 2.51 |
| Laptop, Apple M5 Max⁶ | |||||||
| nzbfast | 0.10 | 0.40 | 1.15 | 0.10 | 0.98 | 0.99 | 0.94 |
| unrar 7.22 | 0.16 | 1.94 | 1.87 | 0.15 | 1.75 | 1.91 | 1.52 |
| rarpar | 0.11 | 2.09 | 1.97 | 0.18 | 1.54 | 1.55 | 1.33 |
Where the field could not compete, and why. ¹ The 7-Zip raced here is the Homebrew package, which refuses every compressed shape with ERROR: Unsupported Method and reads only the stored one on macOS. An earlier version of this page put that down to 7-Zip's macOS build, which was wrong: Homebrew builds it without the non-free unRAR codec, while the macOS build 7-zip.org ships carries the codec and decodes all seven shapes, as the Windows build does. Re-measured 14 August 2026. If you install 7-Zip from the project rather than from Homebrew, this column does not describe what you have. ² bsdtar has no RAR5 multi-volume support and produced a truncated file without reporting an error, so that leg is a correctness failure rather than a slow time; our harness caught it by checking the output, which is why it is worth checking the output. ³ bsdtar: Encryption is not supported. ⁴ bsdtar: Declared dictionary size is not supported. ⁵ unar ships no Windows command-line tool, so the laptop field is five. ⁶ The M5 Max group races the three tools a macOS reader would actually reach for - unrar, rarpar and us; unar, bsdtar and 7-Zip were not raced on that machine. Its unrar is 7.22, the newest build that runs unattended there.
Every shape on every machine except one, and that one is a tie. The short-match shapes come down to two specific things in our decoder. A match of two to thirty-two bytes used to pay for a full call into the platform's memory-copy routine, and the call cost more than the copy; copying a fixed thirty-two bytes through a register instead is why repetitive, solid and the 128 MiB dictionary - the three shapes built out of short matches - are all quick at once. And the checksum runs downstream of the writer's thread rather than on it. The one cell we do not win outright is the stored shape on the 32-core desktop, where unrar and we are three milliseconds apart on a leg that is purely moving bytes - identical at this table's precision, so both cells are marked and it is scored a tie, not a loss and not a win.
The shape we win by the most is the one usenet actually posts hundreds of at a time: 400 small files, 4.3× and 4.4× against unrar and 5.4× to 5.5× against rarpar. That is per-member parallelism, and it is the difference between an extractor written for a download queue and one written for a command line. The stored shape, which the census above says is 84% of the bytes on the wire, is a near tie for the three serious tools, because at that point everybody is just moving bytes.
One choice worth declaring. The archives are packed with the compressor pinned to four threads. RAR's block split otherwise follows the core count of whatever machine packed the archive, so a 32-core box and a 20-core box produce different bytes from the same input and the machines stop being comparable. Pinning it makes the extraction corpus byte-identical everywhere, which is the point, but it also caps how much of the decode can run in parallel - so when the two closest shapes were losses we re-raced them against archives packed with all 32 threads, to check that the pinning was not what caused it. It was not: solid moved from 4.2% behind to 2.4% behind and the 128 MiB dictionary from 6.6% to 6.3%, the same ordering either way. Both are now wins on the pinned corpus by a wider margin than that check could account for.
Why there is no RAR4 row, and what happens to those posts. Every shape above is RAR5 or RAR7, which is what usenet posts today. Older RAR4 archives still turn up, and the same engine reads them, including the compressed and password-protected forms, in the same single pass as the newer ones rather than writing the volumes to disk and unpacking them afterwards. They get no row here because the official rar 7.23 can no longer create RAR4, so there is no neutral corpus to race the field on; that work is checked against archives written by WinRAR 3.00 instead, byte for byte against unrar.
Corpus: 1 GiB of random payload packed store-mode into 21 RAR volumes, then two PAR2 sets at 10% redundancy, one at 1 MiB blocks and one at 64 KiB, then fixed damage maps. Every run uses the same protocol: fresh copy, read the whole corpus once to warm the cache, then time. Best of three interleaved rounds; every repaired volume is compared against the pristine set on every round. Lower is better.
A correction about the corpus, because an earlier version of this page overstated it. We said every machine ran a byte-identical corpus, checked by hash. Hashing every volume of every set shows that is true of the 32-core desktop and the Windows laptop, which match exactly, and not of the 20-core desktop, which holds a different random draw of the same shape: the same 21 volumes at the same sizes, the same two block sizes, and damage verified at the same 3, 101 and 1,500 blocks spread across the same number of files. Every number within a row is still measured on bytes that every tool in that row shares, which is what each comparison rests on. But the rows are not four views of one input, and since payload character is worth about 7% to one competitor's scanning, that is worth stating rather than glossing.
Which par2 is which. The original par2cmdline is the reference implementation everyone forked from. par2cmdline-turbo is the fork that vendors ParPar's hand-written SIMD Galois-field kernels: that is precisely what the "turbo" means, and it is why turbo, rather than the original, is the tool worth measuring against. Both turbo columns below run those same ParPar kernels. What separates them is not the arithmetic but the build and the flags.
Confirmed on the shipping build against the current rival, 24 August 2026. These tables were measured before 1.2.2 was cut and before par2cmdline-turbo released 1.5.0 (20 August 2026), so the 20-core column was re-raced on both: our 1.2.2 release build against turbo 1.5.0, three interleaved rounds per leg, every repaired file compared against the pristine set. All four legs reproduce - ours 0.18 / 0.30 / 0.75 / 2.02 against the 0.19 / 0.33 / 0.74 / 2.07 printed here, and turbo 1.5.0 lands within a few percent of the build in the table on every leg and both configurations. The cells stand as published; the other three machines keep their own dates.
So the competition appears twice, and one of those columns is its best case rather than its default. The release binary you would download is compiled for a generic baseline CPU and hashes only a couple of files at a time; building the same source for the actual host CPU and passing -T16 lets it use the instructions that machine really has and hash sixteen files at once. On the laptop that is worth up to 2.6x, entirely from build and flags. Judge us on the tuned column, which is the harder comparison; the as-shipped column is what someone who downloads it actually experiences. par2cmdline is the original, version 1.2.0, built from source on each machine. rarpar is Weaver's own PAR2 implementation, built from source with its Metal GPU backend enabled. MultiPar's par2j is Windows-only, so it appears on the Windows laptop rows alone. The M5 Max rows race the two tools with current macOS arm64 builds beside the two turbo columns; par2cmdline classic was not raced on that machine.
| seconds, 1 GiB set | desktop, 32 cores | desktop, 20 cores | laptop, 14 cores | laptop, M5 Max |
|---|---|---|---|---|
| no damage - clean verify | ||||
| nzbfast | 0.11 | 0.19 | 0.23 | 0.18 |
| par2-turbo, tuned | 0.31 | 0.38 | 0.42 | 0.28 |
| par2-turbo, as shipped | 0.86 | 1.12 | 1.06 | 0.80 |
| par2cmdline | 3.03 | 3.84 | 3.81 | not raced |
| rarpar | 2.62 | 3.45 | 2.96 | 2.32 |
| MultiPar | Windows only | Windows only | 1.34 | Windows only |
| 3 blocks damaged - a few dead articles | ||||
| nzbfast | 0.22 | 0.33 | 0.46 | 0.26 |
| par2-turbo, tuned | 0.51 | 0.66 | 0.78 | 0.48 |
| par2-turbo, as shipped | 1.08 | 1.46 | 1.42 | 1.00 |
| par2cmdline | 3.64 | 4.58 | 4.98 | not raced |
| rarpar | 4.27 | 5.53 | 4.99 | 3.64 |
| MultiPar | Windows only | Windows only | 1.71 | Windows only |
| 101 blocks damaged | ||||
| nzbfast | 0.48 | 0.74 | 0.96 | 0.66 |
| par2-turbo, tuned | 0.88 | 1.17 | 1.40 | 0.85 |
| par2-turbo, as shipped | 2.04 | 2.65 | 2.69 | 1.84 |
| par2cmdline | 5.57 | 7.57 | 11.7 | not raced |
| rarpar | 4.73 | 5.73 | 5.74 | 4.17 |
| MultiPar | Windows only | Windows only | 2.65 | Windows only |
| 1,500 blocks damaged - 91% of recovery used | ||||
| nzbfast | 1.00 | 2.07 | 2.46 | 1.61 |
| par2-turbo, tuned | 3.00 | 5.52 | 6.73 | 4.07 |
| par2-turbo, as shipped | 5.21 | 8.20 | 9.30 | 6.01 |
| par2cmdline | 67.7 | 86.1 | 403 | not raced |
| rarpar | 7.15 | 11.49 | 14.22 | 6.91 |
| MultiPar | Windows only | Windows only | 5.40 | Windows only |
All sixteen nzbfast cells - four machines at four damage levels - are ours, several by more than 2× against the tuned build and by 2.3× to 7.7× against the one you would actually download. The heavy-damage cells are the interesting ones, and the note below explains the algorithm behind them.
The original is back in the table, and it is worth seeing why the fork exists. An earlier version of this page dropped the par2cmdline column on the grounds that it was slower than everything else in the round, which is true and is not a good enough reason: it is the implementation almost every other tool is descended from, and readers deserve the baseline rather than our assertion about it. On the heaviest damage level it takes about 69 s where the SIMD fork takes 3.2 s and we take 3.1 s. That factor of twenty is the whole argument for the hand-written Galois-field kernels, and it is the same argument we make for ours.
Light damage is the case that matters. A handful of failed articles is far more typical than 101 dead blocks, and nothing like 1,500. Most of a light repair is not the Reed-Solomon maths at all, it is reading and MD5-ing a gigabyte, which is why the 3-block row tracks the clean-verify row rather than the repair ones.
The heaviest damage level is a different kind of work, and it gets a different algorithm. That last level damages 1,500 blocks across all 21 volumes and consumes about 91% of the recovery data, which is where the Reed-Solomon arithmetic, rather than hashing or disk, becomes nearly all of the work. The shipping build computes the heaviest repairs with a number-theoretic transform instead of the classic Galois-field fold - the same maths, evaluated in a form that scales far better at high block counts: 2.7× ahead of the tuned build on the 20-core desktop, and on the Windows laptop 2.7× ahead of the tuned build and 2.2× ahead of MultiPar. Light damage still runs the classic path, which is why the other levels moved barely at all: the transform only pays above about 512 damaged blocks, so below that the dispatcher does not use it.
A faster path is only worth having if it cannot be wrong. Both paths compute the same quantity and are bit-identical by construction, and every repair on this page was gated on the rebuilt files matching the pristine set: 228 timed repairs across the machines in this round, zero mismatches. The shipping build does not rely on that record. Every repair verifies its own output against the file hashes, and one that failed would be redone with the classic path automatically, log the divergence, and keep the classic path for the rest of that run. The setting is in the dashboard as Fast PAR mode if you would rather not have it at all, and machines with too little memory for it decline it on their own rather than trying and failing. Re-measured on 2 August on the current build: the two desktops land within a few percent of this table, and with Fast PAR mode switched off the 20-core desktop falls back to exactly the classic path's slower time, which is what says the win is the method and not the conditions.
The Windows laptop's column needed a correction, and it goes against us. Windows demotes sustained background work onto its efficiency cores a few seconds in. Our daemon opts out of that at startup and none of the other tools can, so an earlier version of this page published their throttled times as though they were the tools' own. Rerunning that machine with every tool lifted to high priority moves the whole field: on the heaviest damage level par2-turbo goes from 22.4 s to 6.41 and rarpar from 59.2 s to 14.4, and for one cut of this page that turned the column from ours into one we lost. The whole laptop column is measured that way now - the correction stays even though the row has since been won back by the algorithm change above, because the field's times on that machine are only honest with the throttle lifted.
When PAR2 cannot cover the damage, the recovery record inside the RAR itself is the last line of defence. Until 1.0.8 ours failed on any archive over about 13 MB, so this leg could not be run at all. Damage is three 3,000-byte holes at 20%, 50% and 80% through the protected region. Both tools produced output byte-identical to the pristine file, and ours is byte-identical to what rar r itself writes. Best of three, 32-core desktop, both tools re-raced together on 2 August.
| 16 MB | 32 MB | 128 MB | 512 MB | 2 GB | |
|---|---|---|---|---|---|
| nzbfast | 0.049 | 0.059 | 0.130 | 0.400 | 1.527 |
| rar 7.23 repair | 0.278 | 0.466 | 1.065 | 2.291 | 6.400 |
| advantage | 5.7× | 7.9× | 8.2× | 5.7× | 4.2× |
An earlier version of this page showed the 512 MB size as a loss, and explained it as the price of working through the volume in pieces rather than holding all of it in memory. That explanation was correct at the time and is now obsolete: the cost was a bit-serial CRC64 in the repair path, replaced with a table-driven one, and the loss went with it. There is no longer a crossover, and the bounded working set was kept. The 2 GB size is here because the volumes a daemon actually meets are 8 GB to 20 GB, not 512 MB, and a leg that stops below the real range is not much of a test.
What moved this cut, and the control that says so. Finding which blocks are damaged had become the largest phase of this repair - larger than the repair arithmetic itself - and it ran on a single thread, reading 64 KB out of every group across the file, once per group. It now makes one sequential pass in file order with the per-shard checksums computed in parallel, and the repaired volume is cloned rather than copied where the filesystem can do that. Detection alone fell from about 300 ms to 18 ms on the 512 MB archive, which is most of what moved above. The control is the column beside ours: rar r was re-raced in the same rounds on the same machine and came back within a few percent of its previous times, so the change in the gap is ours and not the bench's.
The M5 Max repeats the pattern, raced 31 July with the same corpus and gates: 0.050 / 0.066 / 0.171 / 0.581 s against rar r's 0.211 / 0.335 / 0.751 / 1.735 across the 16 MB to 512 MB sizes - 3.0× to 5.1× faster; the 2 GB size was not raced on that machine. Those figures predate the detection rewrite described above, so they are the older build's, kept here as the second machine rather than as a current number.
Weaver's rarpar is absent from this table alone, and not by choice: it does not implement this repair. Asked to fix one of these archives it answers "embedded Rar5 recovery record detected ... this API restores standalone .rev recovery volumes only and does not consume embedded RR/protect data", and leaves the file damaged. It appears in every other comparison on this page: all four PAR2 legs above, all seven extraction shapes above that, and the recovery-volume leg immediately below, which is the job it says it does - and which it wins.
.rev filesThe other half of RAR's own recovery story, and until this round the largest loss on this page. A .rev file is a standalone recovery volume: three of them beside a 21-volume set can rebuild any three volumes that never arrived. Corpus: 1 GiB stored into 21 volumes of 50 MB with rar rv3, then volumes 4, 11 and 19 deleted - three lost against three recovery volumes, which is the worst case the set can still survive. Best of three, every rebuilt volume compared against the pristine one.
| desktop, 32 cores | desktop, 20 cores | |
|---|---|---|
| nzbfast | 0.44 | 0.50 |
rar 7.23 rc | 0.46 | 0.58 |
rarpar restore-volumes | 0.48 | 0.61 |
The 32-core cell here was 3.12 s against rar rc's 0.47 in the last cut of this page, published as 6.6× slower and the worst number on it. The cause was the erasure solve running at about 48 MB/s of rebuilt output where RARLab's managed 320; it now runs on the same table-driven arithmetic as the rest of the recovery code, which is a sevenfold improvement and turns the loss into a win on both machines. The margins are 3% and 14%, so it is a win to state plainly rather than to headline, and the reason it is stated at all is that the loss was stated first.
This leg exists because Weaver's rarpar implements exactly this and asked to be measured on it. It was winning comfortably when we first published it, and we published it then for that reason.
The file matching was never the cost, which is worth recording because it was the intuitive suspect: recovery volumes carry no filenames, so we identify which slots survived by checksumming every volume on disk rather than trusting what they are called, and against an undamaged set, where matching is all that happens, the whole pass takes 0.18 s.
What else moved, and where it does not show. Two more engine changes landed that these corpora cannot see, listed here so the numbers above are not read as the whole story: RAR5 archives with tens of thousands of members resolve each member once rather than walking the list per worker, which is 3× less processor time at 40,000 members; and the RAR1.3 bit reader works a word at a time, which is 2×. Neither appears above, because the shapes here have 400 members and no RAR1.3.
What we deliberately do not do: we never create PAR2. A downloader has no reason to, and ParPar owns that leg. We also buy speed with memory on both engines: extraction peaks around 240 MB against unrar's 41 MB, and verify around 126 MB against turbo's 7 MB, because these are the inline engines that ride a live download rather than standalone one-shots. The 128 MiB-dictionary shape is the worst of it, at about 304 MB against unrar's 139 MB. The heaviest repair now costs memory too: the faster method for 512-plus missing blocks works from the recovery data held resident, so it is allowed up to a quarter of the machine's RAM, capped at 4 GB, and a machine that cannot spare that quietly takes the low-memory method instead - the same arithmetic and the same times as the middle rows of the PAR2 table, just not the 3× on the last one. If you want the smallest possible resident set for a standalone job, the dedicated tools still win that column.
Capability, not micro-benchmarks
| nzbfast | SABnzbd 5 | NZBGet 26 | rustnzb | Weaver | Usenapp | Newsbin | |
|---|---|---|---|---|---|---|---|
| pipelined NNTP | yes | off by default | no | yes | -⁷ | - | - |
| full verify during download | every block | after | quick-check | after | after | after | after |
| extract during download | in-stream, no volumes on disk | direct unpack⁴ | direct unpack⁴ | stages, then unpacks⁵ | no | no | no |
| disk needed for an N-GB post | ~1×N | ~2×N | ~2×N | ~2×N | ~2×N | ~2×N | ~2×N |
| pre-download completability verdict | block-exact | no | health % | no | -⁷ | article check | no |
| bounded memory (never swap) | budgeted | cache-limit setting | cache setting | no | no | - | - |
| raises its own open-file limit | yes, at startup | -⁸ | -⁸ | -⁸ | -⁸ | -⁸ | -⁸ |
| check the file at any point while downloading | yes | no | no | no | no | sequential | no |
| built-in indexer + poster wall | yes, keyless | no | no | no | no | search UI | group browser |
| Sonarr/Radarr drop-in | SAB API + Newznab | native | native | SAB-compat API | NZBGet-compat RPC⁷ | no | no |
| phone remotes (nzb360/LunaSea) | yes | yes | yes | no | -⁷ | no | no |
| watchlist auto-grab + upgrades | built in | via *arr | via *arr | no | no | Watchdog | rules |
| single self-contained binary | yes | app bundles; Python on Linux | yes | yes | yes | .app | .exe |
| open source | GPL⁶ | GPL | GPL | MIT | yes | paid | paid |
| platforms | mac/win/linux (x64 + ARM)/docker/flatpak | mac/win/linux/docker/NAS packages | mac/win/linux/docker/NAS + embedded | linux/win (mac from source) | mac binary; source elsewhere⁷ | mac only | win only |
⁴ Direct unpack still materialises the volumes first: 2× writes and 2× disk. ⁵ rustnzb 1.4.5 delivers every fixture byte-correct in the 23 August 2026 round, and its measured device I/O there is about 2.1x the payload - so it stages the volumes and unpacks after the download rather than extracting in-stream (see the cost tables). Its older builds (1.3.4-1.3.9) shipped obfuscated volumes marked "Completed" without extracting; that failure is fixed upstream in 1.4.5. ⁶ GPL-3.0-or-later. ⁷ Weaver 0.7.8, the newest shipped binary, identity proven by hash (the published release tarball's sha256 and the binary inside it both match what we race); its measured rows come from the 23 August cost round, its capability cells marked "-" are features we have not assessed rather than confirmed absences; it speaks an NZBGet-compatible RPC, which is how our harness drives it, but we have not tried the phone remotes against it. Usenapp/Newsbin are single-platform commercial readers with downloader features; they're listed because people ask, not because they compete on speed.
⁸ macOS starts a program with a limit of 256 open files, and a full set of connections across several servers can pass it. nzbfast raises its own limit at startup on macOS and Linux: it asks for 65,536, steps down until the system agrees, never goes above the system's hard limit, and carries on with whatever it had if every step is refused. Windows has no per-process limit of this kind. The other columns are not assessed rather than confirmed absences: we have not read any other client's startup code. Worth knowing because of how it fails: a program that runs out of open files part-way through a job tends to disappear rather than report an error.
Transport proof · measured on 1.2.2
Earlier cuts of this page carried a wider set of transport demonstrations - multi-line saturation runs, per-RTT pipelining gains, a backpressure proof, decode-ceiling measurements - raced on builds that v1.2.2 has since superseded. Under this page's rule they are retired rather than left to age, and return as they are re-cut on the current release; the three claims above are the ones already re-measured on v1.2.2.